
Lighthouse scores of 16 developer portfolios: immersive vs minimal
Mobile Lighthouse, 3 runs each, on 16 well-known developer portfolios: 3D median 35.5, minimal 74.5. The method, the results and what the score misses.
On mobile Lighthouse, the 10 immersive (WebGL) portfolios I measured had a median performance score of 35.5; the 6 minimal ones had 74.5. Only one of the 16 scored 90 or more, and only one had a good lab LCP. Below: the method, the results, and what a Lighthouse score can't tell you about a 3D site.
TL;DR
- Why the gap: the median 3D site weighed about 12 MB and blocked the main thread for about 2.2 s; the median minimal site, 0.9 MB and 0.23 s.
- The top is nearly empty: no immersive site scored above 64, and the one minimal site at 90+ used system fonts.
- Read with care: lab numbers, three runs each, with a desktop GPU, so the 3D sites likely look better here than on a real phone. No site is named for a low score.
Why measure other people's portfolios?
My old portfolio was a three.js flight through the solar system, and it scored 34 on mobile Lighthouse.
Before rebuilding it (the whole story is in the case study), I wanted to know: is that normal for the genre, or just me? So on 5 October 2026, I measured 16 well-known portfolios the same way.
I name no site for a low score. I learned three.js from a course taught by one of the people in the immersive group, and these sites are some of the most inventive work on the web. A 30 on an emulated phone says something about loading. It says nothing about craft.
How did I measure?
- 01 Pick 16 sites 10 immersive (8 portfolios, 2 studios), 6 minimal
- 02 Run Lighthouse 3 times Mobile profile, simulated throttling, back to back
- 03 Take medians Each site's median, then the median of each group
- 04 Check on a phone Playwright at 390 px: gates, reduced motion, zoom
| Setting | Value |
|---|---|
| Tool | Lighthouse 13.5.0 CLI, headless Chromium 153 |
| Device | the default mobile profile: Moto G Power, 412 × 823 px, device pixel ratio 1.75 |
| Throttling | simulated: 150 ms round trip, 1.6 Mbps down, 4× CPU slowdown |
| Date | 5 October 2026, from Poland |
Immersive means famous three.js portfolios, recent Awwwards and FWA Site of the Day winners, and two studio sites as a ceiling for craft. Minimal means well-known engineer and design-engineer portfolios, some with a lot of micro-interaction polish.
Two caveats before any number. The machine was shared with other jobs: Lighthouse's CPU benchmark (benchmarkIndex) ranged from 841 to 2,381 on each site's first run. Three runs damp that, and byte counts don't depend on it.
And Lighthouse's own docs say "a lot of the variability" in a score "is not due to Lighthouse". They suggest thinking of performance "as a distribution of scores, rather than a single number". Read the medians, not the decimals.
What were the results?
| Mobile, median of 3 runs | Immersive (10) | Minimal (6) |
|---|---|---|
| Performance score | 35.5 | 74.5 |
| Highest / lowest score | 64 / 26 | 95 / 65 |
| Sites in green (90+) / orange (50-89) / red (under 50) | 0 / 1 / 9 | 1 / 5 / 0 |
| Page weight | about 12 MB | about 0.9 MB |
| JavaScript | about 750 KB | about 265 KB |
| Total blocking time | about 2.2 s | about 0.23 s |
| Largest contentful paint (LCP) | about 20 s | about 4.0 s |
| LCP of 2.5 s or less | 1 of 10 | 0 of 6 |
| Cumulative layout shift | 0.004 or less | 0 |
Weight and blocking time make the gap; layout shift costs nobody anything, because a full-screen canvas doesn't move. Since Lighthouse 10, total blocking time is 30% of the score and LCP is 25%. A page that blocks for seconds and paints late can't score well, whatever it looks like.
Desktop is a different story. In a single desktop run, one studio site scored 90; on mobile, the same site scored 38. That gap is the whole problem.
Why were the immersive sites slow?
Three patterns came up again and again:
- No early text to paint. web.dev's list of LCP candidates (images,
<image>in SVG, video, CSS background images, block-level text) has no<canvas>. When a page is a canvas plus a loader, the LCP lands on whatever text appears, often the loader's own label. Two sites showed 0 and 1 characters of DOM text on a phone. - A lot of JavaScript, run up front. Of the four immersive sites I broke down, three did 10-23 s of main-thread work under the 4× CPU slowdown, and one did far more. Two minimal sites did 1.4-1.7 s. Most of it was script evaluation.
- Big media during load. Multi-megabyte autoplay video and textures, fetched while the page was still loading.
The one immersive site with a good LCP (1.1 s) did one thing differently: its bio text was in the server-rendered HTML, with WebGL layered on top. It still lost points to 15.3 MB of video loaded eagerly and to 2.2 s of blocking time. Text first fixed the paint. It didn't fix the weight.
Is "minimal" automatically fast?
No. The one site at 90+, leerob.com (95), used system fonts, so 0 bytes of web fonts, about 240 KB of JavaScript and no third-party scripts. Two other minimal sites shipped more than 1 MB of web fonts each, in 9 files, and both missed the LCP threshold mainly because of them.
Fonts are part of loading, not decoration. It's one reason this site ships a single variable font of about 50 KB.
What doesn't Lighthouse measure?
- The GPU. Lighthouse throttles the network and the CPU; its throttling docs never mention the GPU. My runs drew on the host's desktop NVIDIA RTX 2060, so on a real phone I'd expect the 3D sites to do worse, not better.
- Real phones and real people. web.dev says lab data comes from "a single device… connected to a single network", while field data covers "a wide variety of network and device conditions". None of these are field numbers. And with no user input, Lighthouse can't measure INP; total blocking time is the lab stand-in.
- What's behind the gate. Three of the ten immersive sites put a start button or a "tap to explore" prompt before the content. Lighthouse measures the gate, not the experience.
- Accessibility beyond automation. The accessibility score is a weighted average of pass/fail audits. One studio site draws everything in WebGL, shows 0 characters of DOM text on a phone, and scored 100: there was almost nothing to fail. Five of the ten immersive sites scored 100.
- Craft. There is no audit for "I remembered this site a week later".
A separate Playwright check at a 390 px phone viewport (Chromium emulation, not real iOS) found three things the scores don't show:
- All ten immersive sites render something on a phone; one still warns it's "best viewed on a desktop".
- With reduced motion emulated, none of the ten changed: each still created a WebGL context and kept its frame rate. How to do it properly is in the post on reduced motion and a pause button.
- 4 of the 16 (3 immersive, 1 minimal) disabled pinch zoom in their viewport tag. That fails the axe rule "Zooming and scaling must not be disabled", which exists for people with low vision who rely on magnification.
Where does my old site fit?
My old space portfolio scored 34 on mobile, with the same Lighthouse version on the same day: just under the immersive median. With 13.8 MB before its start button, it was heavier than the median immersive site too. It wasn't one of the 16, and its run had no GPU, so it's not a perfect match. But it would have fit right in. What made it slow is in Why my three.js portfolio was slow on mobile.
What does this site do about it?
- Text first. The H1 is the LCP: rendered on the server, final in the first paint, never animated in.
- A budget before code. Lighthouse mobile 90+ on every page, LCP under 2.5 s, under 150 KB of JavaScript and 100 KB of fonts.
- 3D as an optional layer, never on the critical path: no WebGL in the hero, and the shaders on other pages wait for the reader's first move.
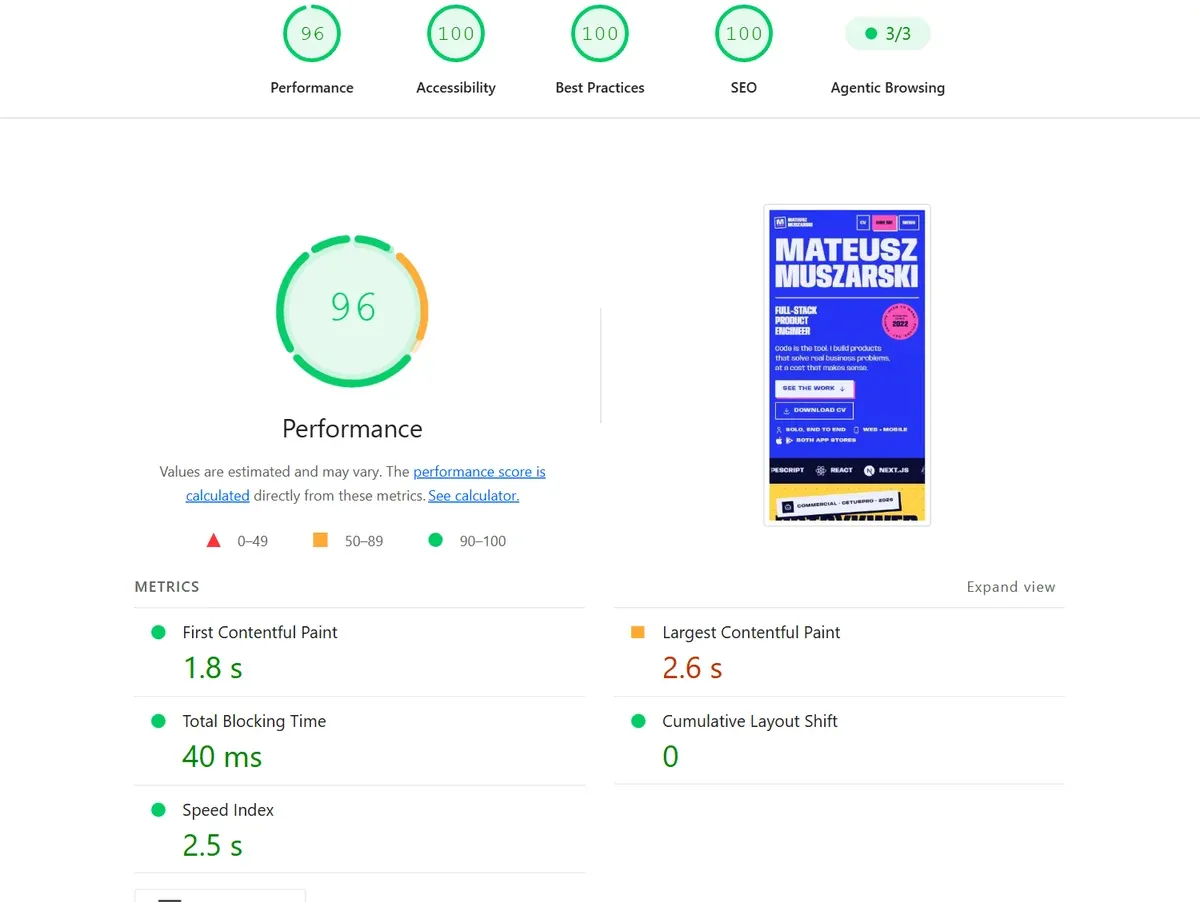
It's not a fair fight: there's no WebGL in my hero. That's the trade I chose.
Limits
- Lab only: one machine, one day, a shared host, three runs per site. No field data for any of these sites.
- 16 sites is a sample, not a census, and I chose it.
- Nothing ran on a physical iPhone or Android phone, where these sites are actually judged.
- Desktop was one run, for a subset only.
- My home page was measured on a local build. Its median LCP (2.3-2.6 s across the three languages) sits around my own 2.5 s budget, and the live site hasn't been re-measured since 7 October.
To see what I build under budgets like these, browse my work.
Sources
- Lighthouse performance scoring (Chrome for Developers) (opens in a new tab) (accessed )
- Lighthouse throttling (GoogleChrome/lighthouse docs) (opens in a new tab) (accessed )
- Lighthouse config constants: mobile screen emulation (GoogleChrome/lighthouse) (opens in a new tab) (accessed )
- Largest Contentful Paint (LCP), web.dev (opens in a new tab) (accessed )
- Web Vitals (web.dev) (opens in a new tab) (accessed )
- Why lab and field data can be different (web.dev) (opens in a new tab) (accessed )
- Lighthouse accessibility scoring (Chrome for Developers) (opens in a new tab) (accessed )
- meta-viewport: Zooming and scaling must not be disabled (Deque, axe rules) (opens in a new tab) (accessed )
- Solar System Scope, planet textures (CC BY 4.0), used in the old space portfolio (opens in a new tab) (accessed )